Using FRD Consortium tools to design a speakerIntroductionThis mini-tutorial describes the steps required to design a speaker using the manufacturer's driver data along with some of the Frequency Response Data (FRD) Consortium's wonderful spreadsheet tools. This design method requires no measurement equipment at all, just pure simulation, so accuracy is not guaranteed but it still gets you as close as you're going to get without a measurement setup. I've compared measured data with data generated via this method and the difference was only a few dB across the frequency response. I've found that these tools are great for experimenting with different driver combinations prior to buying and building. Just about every speaker I've designed began with FRD tool analysis to determine how well things would work out and I've found that this method is very effective and almost guarantees success once you start building with the actual drivers. I would recommend, however, that you use a measurement setup to analyze and design the final crossover in order to properly fine tune the system. If you don't have measurement capabilities then this method probably gets you as close as you can get to an optimized design as long as the drivers aren't too far from the suggested manufacturer's data.Procedure OutlineIf you don't already have them, download the SPLTrace, Unibox, BDS, and FRC programs from the FRD Consortium website...FRD(Frequency Response Data) Consortium You'll need Microsoft Excel to run the Unibox, BDS and FRC spreadsheets. Also download Speaker Workshop if you don't have a crossover design tool or use one of the FRD Consortium's crossover design tools. The updated version of Jeff B's Passive Crossover designer is not on the FRD site but is at the link listed below. Speaker Workshop Jeff Bagby's Passive Crossover Designer (Excel)
SPLTraceFind the manufacturer's data for the driver that you want to process and locate the frequency and impedance response plots. Select the plot area and (right click) copy the plot to the clipboard. Start the SPLTrace program. Select "File>Import Graph>From Clipboard" to load the response plot. Under the "Alignment" menu select the plot limits and mark the corresponding points on the graph using the mouse. Select "Trace>Options..." and choose "Use Trace Limits." Then enter the desired start frequency, stop frequency and number of data points. Next select "Trace>Start SPL Trace." Begin the SPL Trace by positioning the mouse at the starting point of the plot. I prefer to use the keyboard to trace the plot once the first point has been located with the mouse. Use the arrow keys to move the cursor and press enter to select each data point. Once the trace range has been covered, save the frd data by selecting "Trace>Save" and choosing a file name. To start the impedance trace you first have to select "Trace>Stop Trace" then select "Trace>Start Impedance Trace" and follow the same procedure used to enter the SPL trace. Repeat this procedure for each driver you plan to use in your system.UniboxUnibox is a very powerful spreadsheet for designing speaker enclosures and evaluating their performance. I have not found another "free" enclosure design tool that comes close to offering the capabilities that Unibox has. Note that this step is not required if you are simulating a tweeter. First try to find your desired driver in the "Driver Data Base" and import additional drivers using the "import" button. If your driver is not in the database then enter the parameters under the "Drive Unit Parameters" section including the Fs, Re, Qms, Qes, Sd, Vas, Xmax peak, and Le. You can leave the Le2 and Re2 sections at 0.00. Regardless of whether you selected the driver from the database or entered the drive unit parameters manually, you should set the "Nominal Power" section to 1 Watt.Now you must determine the type of enclosure that was used for the manufacturer's frequency response measurement data and simulate that enclosure. Typically manufacturer's will use either a closed box with a fixed volume or an infinite baffle which can be simulated as a closed box with a very, very large volume (on the order of 1000L). Under the closed box section enter the desired closed box volume in the "Physical Vb" section and then select the "Graphs Update" and "Frequency Reponse Update" buttons. Finally save the frequency response data by selecting the "Export Frequency Response [FRD]" button. Next determine the type of enclosure that you plan to use for this driver in your project. Enter the enclosure parameters under the appropriate section, update the graphs and save the data. Baffle Diffraction SimulatorThe Baffle Diffraction Simulator (BDS) spreadsheet is another very powerful tool that allows you to simulate the effects that a speaker's front baffle has on the frequency response of a particular driver. First select the "Add Basic Frequency Support" button and wait for the processing to complete then select the "Add Advanced Support" button. Next set the "Sample" setting to "Quadruple" and the "Source" setting to "Combined." The "Edge" setting should be set to "Complex" if you the cabinet has rounded edges, "Chamfer" if the edge is chamfered and "Sharp" if there is no edge modifications. The "Shape" setting is usually set to "Quadrangle" which accomodates the common rectangle box shape. The "Type" setting should be set to "Separate" and the "Chart" setting should be set to "SumDown." Driver parameter information is located on the right side of the screen. Check the "True" box for each driver that you want to include in your simulation. Driver 2 is specifically designated to be the tweeter. You must enter the size and location for each driver. Next input the cabinet dimension coordinates in the appropriate boxes located on the left side of the screen. I usually turn the "Shape Logic" selection off in order to allow more flexibility with cabinet dimensions. Next set the "Edge Size" parameter to match the amount of chamfer or roundover used on the cabinet edges. Also adjust the "Baffle Tilt" value if you have an angled baffle. Finally set the "Axis Dist" value to 36 which corresponds to a measurement distance around 1 meter.Now that all of the cabinet and driver information has been entered, you can save this information by selecting the "Save Profile" option. Now you have to save the baffle diffraction response information for each driver analyzed. To do this, select the driver number with the dropdown box located under the "Save Response" button and click the button to save the baffle diffraction response for each driver individually. To preview the baffle diffraction responses, scroll down slightly to reveal the "Individual Driver Response" plot. If the manufacturer specifies a fixed baffle size for it's measurement data you must repeat the steps above to determine the measurement baffle response. An IEC baffle is commonly used for manufacturer's measurements and should be simulated with the BDS spreadsheet for later use with the FRC spreadsheet in order to subtract out the manufacturer's measurement conditions. A description of an IEC baffle is below. Note that all dimensions are in centimeters (25.4 mm = 1 inch) and the driver is offset. The smallest baffle listed applies to drivers 8" and smaller. 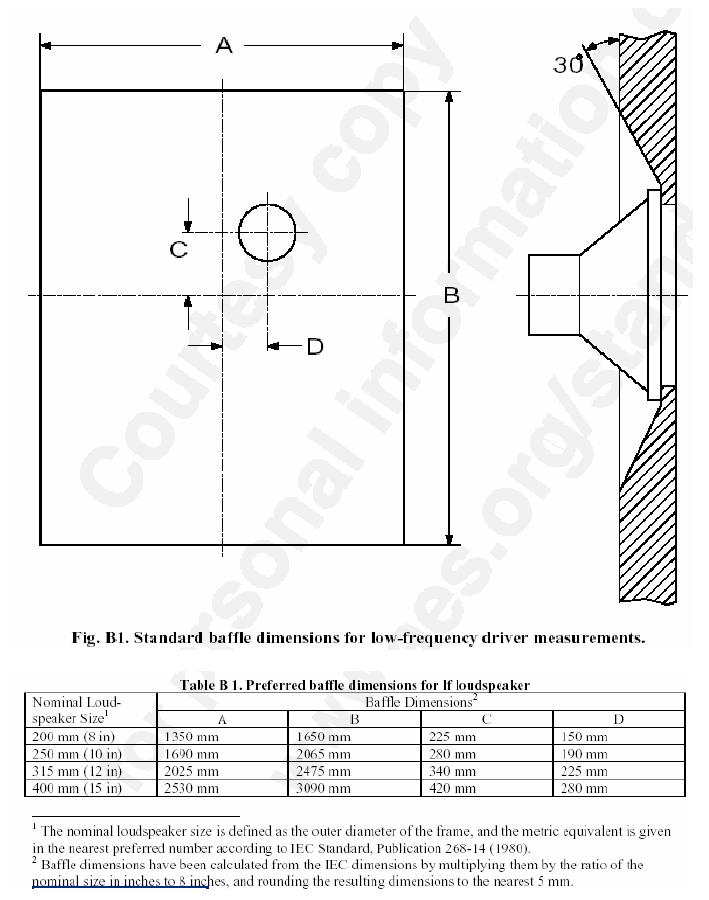
Frequency Response CombinerThe Frequency Response Combiner (FRC) spreadsheet allows you to "subtract out" the manufacturer's measurement conditions and "add in" your target enclosure's effects. Open the FRC spreadsheet and begin by entering the ".frd" files for each parameter. First select "Load" under the "Driver Base" column and find the ".frd" file corresponding the the current driver's frequency response which was initially traced using SPLTrace. Next select "Load" under the "Box Measure" column and find the ".frd" file corresponding to the manufacturer's measurement enclosure response which was generated using Unibox. Select the "Box Target" column to load the Unibox generated frequency response of your enclosure design. The "Baffle Measure" column should be set to match the baffle type that was used by the manufacturer when the driver's measurements were taken. If the baffle size is finite and is known then import the corresponding baffle response file that was generated by the BDS spreadsheet. For example, if an IEC baffle was used for the manufacturer's driver measurements then load in the IEC baffle response that was created using the BDS spreadsheet for that particular driver. If the driver was measured on an infinite baffle, then select "2PI." Finally load the baffle diffraction response file for your cabinet under the "Baffle Target" column.Next you have to normalize the data before combining the responses. Select the "Normalizer" from the menu on the right side of the screen. Adjust the values for "Samples," "Start Freq," and "End Freq" as desired (these are written in red on the left side of the screen). I usually like to use values of 200 samples, 20 Hz start frequency and 40,000 Hz end frequency. I like to keep the number of samples relatively low to prevent the crossover simulator from slowing down too much and the extra frequency extension is required to get good phase information. Next you'll have to determine how you want to extend the slopes of the responses when you apply the normalization. The default values are "Extend Top Slope" and "Extend Low Slope" and these settings should work well for most of the data. The "Extend Slope" mode extends the response along whatever slope it was following for the last few data points. If the "Driver Base" information has a rising response at the top end then you'll have to select a different top end slope normalization setting. You usually want a 2nd order rolloff so I suggest that you select "Aim Top at PointSlope" and choose a frequency, magnitude level and -12dB/octave slope that will give you good results. The "Box Measure" and "Box Target" values should work fine with the default "Extend Slope" settings. The "Baffle Measure" and "Baffle Target" values should be set at "Extend Top Value" and "Extend Low Value" for the best normalization results. Now click on the "Execute" button for each column that has loaded data including the "Baffle Measure" column if you haven't selected "2pi". Once all of the data has been normalized select the "Driver Correction" menu bar once again and choose "Combine Response." This will generate a frequency response for the driver mounted in your test enclosure. Finally you have to generate phase information for this response. First select "Precise Phase & Group Delay" and then "Extract Min Phase." Wait while it determines the phase response for your driver/cabinet combination. Once it is complete you'll have a driver response file that can be used to design a crossover for your project as soon as you select the "Save/Execute" button in the "Sum Response" column to save the response data. If the impedance information doesn't have phase data then you'll have to use the FRC spreadsheet to generate the phase. Measured impedance files usually already have the phase data but traced in impedance responses don't. The phase information is required to get accurate crossover simulation results. To generate phase information select "Impedance Phase Auto-Extract" which is located on the bottom right corner of the mode selection menu. Next select the impedance file you want to process. Once the file is selected the FRC program will calculate the phase response. When the progress indicator reads 100% you will be prompted to save the new impedance response file (.zma) which includes the phase response. Enter a name and save the file. Speaker Workshop (or other crossover design software)Now you're ready to import your .frd and .zma files into Speaker Workshop or your favorite crossover design tool. I'll describe the process for designing the crossover in Speaker Workshop in what follows. Once you've opened up the Speaker Workshop software and started a new project, the first step is to import the .frd and .zma files for each driver (.frd generated by the Frequency Response Combiner spreadsheet and .zma traced from the manufacturer's graphs.) To do this select "Resource>Import." Next you have to select "Resource>New>Driver" to create a driver in SW for each set of speaker data files. To load the .frd and .zma files for each driver, right click on the driver and select "Properties..." Next click on the "Data" tab and you'll see several labels with empty boxes below them. To load the data you must click on the "?" next to the corresponding box. The only boxes that Speaker Workshop uses when evaluating crossover networks are the "Impedance" and "Frequency Response" boxes. Load the imported .zma data into the "Impedance" box and load the imported .frd data into the "Frequency Response" box.Now you are ready to start building your prototype crossover network and evaluating the frequency response of the overall system. First select "Resource>New>Network" to open a blank crossover network. Begin building your crossover by right clicking in the blank network window and selecting a component to insert including the various drivers in your design. To connect parts together, click on a node and drag the mouse to the desired connection and then release the mouse button. If you want multiple connections to a single node you have to hold down the shift button while making the connection. When your crossover network is complete, right click and select "Calculate Response." You should see some new data files in the project tree which have the frequency responses of each driver individually and the overall response. One important step that should be noted is that you have to assign a driver offset to each driver if their voice coils aren't acoustically aligned. For example, with a 2-way speaker with a flat baffle you should set the woofer offset to 0 and the tweeter offset somewhere around 0.5 to 1 which places the acoustic center of the tweeter closer to the listening position as is the case with a flat baffle speaker assuming the target listening axis is in line with the tweeter. For a detailed description on how to use SW to model a crossover click here. ExampleBelow is a screenshot taken from a Speaker Workshop simulation that compares measure driver response data with response data generated using the FRD Consortium tools as described above. On the top plot, the black trace corresponds to the measured data and the magenta trace represents the FRD generated response (note that there is an error in the picture and the colors are reversed on the lower plot.) As you can see, there is a close correlation between the two responses and they differ by no more than 2 dB across the frequency range of interest. I can't guarantee that all simulations will match this well, but this is an example of how accurate this method can be if done correctly.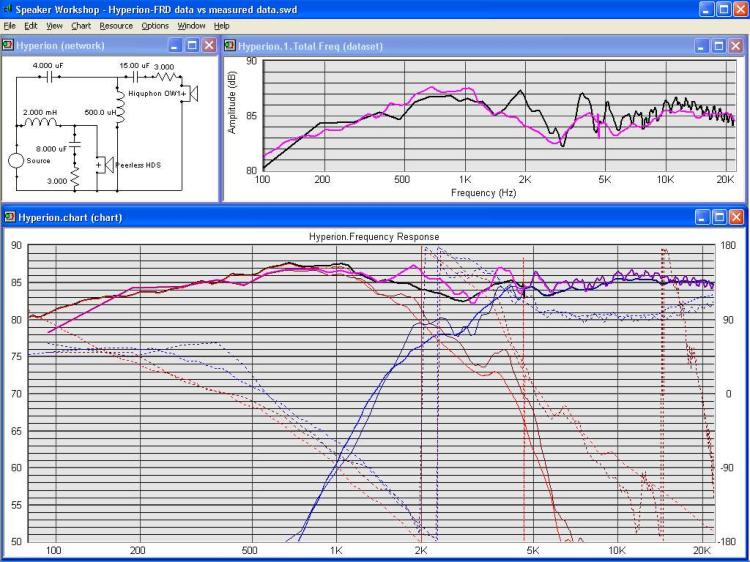
Second Example - 3 way speaker designClick above for a second example of the accuracy and value of using FRD Consortium tools to design a crossover. This time the example is for a three way speaker design and even with if you have full measurement capabilities the FRD tools make it much easier to adjust the crossover in the hard to measure 100-500 region where most woofers cross with midranges. |